World Inequality Report 2026
Content
- Introduction
- India’s Income and Wealth Inequality
- Global Inequality Patterns
- Shifts in Global Geographic Inequality
- Gender Inequality: India and the World
- Climate Inequality and Emissions Responsibility
- Structural Reasons Behind Rising Inequality
- Key Challenges and Policy Recommendations
Introduction
The World Inequality Report 2026, the third major edition after 2018 and 2022, has been released by the World Inequality Lab, under the leadership of renowned economist Thomas Piketty. The report provides a comprehensive assessment of income, wealth, gender, and climate-related inequalities at both national and global levels.
At a time when countries are pursuing inclusive growth, welfare economics, Sustainable Development Goals (SDGs), and climate justice, the findings of this report assume critical importance for policy formulation and governance especially for developing economies like India.
India’s Income and Wealth Inequality
Average Income and Wealth Levels
The report estimates India’s average annual per capita income at around 6,200 euros (PPP), while average wealth per adult stands close to 28,000 euros (PPP). Despite economic growth, these averages mask extreme disparities in distribution.
Income Inequality Trends
Income concentration in India has intensified further since the previous report:
- The top 10% of earners now capture 58% of national income,
- In contrast, the bottom 50% receive only 15% of total income.
This represents a worsening trend compared to the World Inequality Report 2022, where the respective shares were 57% and 13%. The data indicates that economic gains are disproportionately accruing to the upper-income groups.
Wealth Inequality in India
Wealth inequality remains even more pronounced:
- The richest 10% own approximately 65% of total wealth in India.
- Within this group, the top 1% alone control 40% of national wealth.
This highlights a sharp concentration of assets and capital ownership, with serious implications for intergenerational mobility and social equity.
Global Inequality Patterns
Extreme Concentration Extreme Concentration of Wealth
of Wealth
At the global level, inequality has reached unprecedented levels:
- The top 0.001% (around 60,000 ultra-rich individuals) possess three times more wealth than the entire bottom 50% of humanity.
- Their share of global wealth has increased from 4% in 1995 to 6% by 2025.
More broadly:
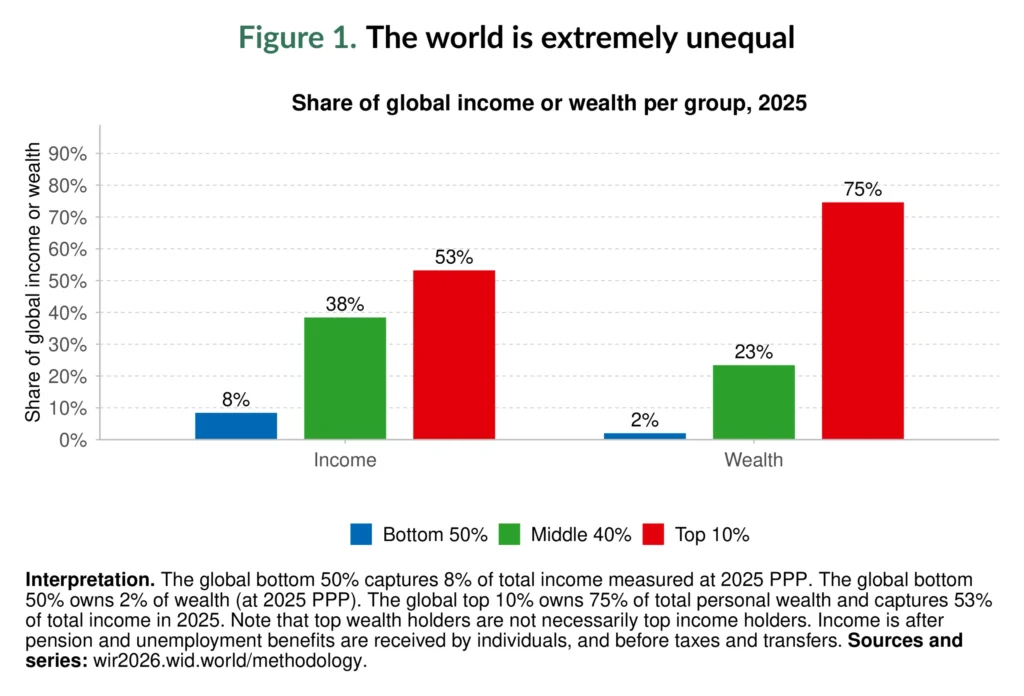
- The global top 10% own 75% of world wealth,
- While the bottom 50% together hold a mere 2%.
The top 1% control 37% of global wealth, which is over eighteen times the wealth owned by the bottom half of the global population.
Shifts in Global Geographic Inequality (1980–2025)
The report also traces how countries have shifted within the global income distribution over time:
- China has experienced significant upward mobility. By 2025, a large proportion of its population has moved into the global middle 40%, with a growing share entering upper-middle segments.
- India, however, has lost relative ground. While a substantial section of Indians occupied the middle 40% in 1980, today almost the entire population lies within the global bottom 50%.
- Sub-Saharan Africa continues to remain heavily concentrated in the lower half of the global income distribution, reflecting persistent development challenges.
Gender Inequality: India and the World
Indian Scenario
India continues to exhibit extremely low female labour force participation, estimated at just 15.7%. Women also face persistent income gaps across sectors, reflecting deep-rooted structural and social barriers.
Global Gender Income Gap
Globally, gender inequality in earnings remains severe:
- Excluding unpaid work, women earn only 61% of men’s earnings per working hour.
- When unpaid care and domestic work are included, women’s earnings fall to just 32% of men’s earnings.
Women account for only 25% of global labour income, a proportion that has seen minimal improvement since 1990.
Regional Distribution of Women’s Labour Income
Women’s share of labour income varies significantly across regions:
- Middle East and North Africa (MENA): 16%
- South and Southeast Asia: 20%
- Sub-Saharan Africa: 28%
- East Asia: 34%
- Europe and North America: around 40%
These figures underline the intersection of economic inequality with social norms and institutional constraints.
Climate Inequality and Emissions Responsibility
The report introduces a critical dimension of climate inequality by linking emissions to wealth ownership:
- The poorest 50% of the global population contribute only 3% of carbon emissions linked to private capital.
- In contrast, the top 10% are responsible for 77% of such emissions.
- The wealthiest 1% alone account for 41%, nearly double the emissions of the entire bottom 90%.
This stark asymmetry raises serious questions about equity, responsibility, and climate justice.
Structural Reasons Behind Rising Inequality
The report identifies deeply entrenched structural causes behind persistent inequality in India and globally:
- Low female workforce participation, limiting inclusive growth.
- Rising concentration of ultra-wealth, leading to economic and political power asymmetry.
- Weak taxation systems, marked by loopholes benefiting the ultra-rich.
- Weak global multilateralism, especially in areas of redistribution, taxation, and climate governance.
Key Challenges and Policy Recommendations
Regressive Taxation Systems
Effective tax rates tend to decline sharply for billionaires and centi-millionaires, resulting in significant revenue losses for states. This weakens public spending on education, healthcare, and climate action.
Way forward:
Strengthen progressive taxation, introduce wealth taxes on the ultra-rich, close tax loopholes, and improve enforcement and compliance.
Gendered Labour Burden
The undervaluation of unpaid care work restricts women’s economic mobility and labour participation.
Way forward:
Recognise unpaid work through public provisioning, expand childcare facilities, promote skill development, and enable flexible work arrangements.
Inter-Country Inequality
India’s relative position in the global income distribution has weakened compared to China, with limited upward mobility into the global middle class.
Way forward:
Expand redistributive social protection mechanisms such as cash transfers, pensions, unemployment benefits, and targeted support for vulnerable households.
Climate Responsibility Gap
High emitters continue to evade accountability, while poorer populations face disproportionate climate impacts.
Way forward:
Adopt a climate justice framework, ensure equitable sharing of emissions responsibility, and incentivise green technologies and sustainable consumption.
Inequality Within the Elite
Even among the wealthy, inequality is widening due to extreme concentration of power and assets.
Way forward:
Increase public investment in human capital, including universal healthcare, nutrition, childcare, and free, high-quality education to reduce early-life disparities.
Conclusion
The World Inequality Report 2026 makes it clear that both India and the world are witnessing historically high levels of inequality across income, wealth, gender, and climate dimensions. India’s declining relative position in the global distribution and persistently low female labour participation point to deep structural weaknesses.
As highlighted by Thomas Piketty, promoting equality is not merely a moral imperative but a practical necessity to address the social and climate challenges of the coming decades. For India, achieving inclusive growth, social justice, and SDG targets will require strong political will, effective governance, and sustained investment in human capital.